from fractions import Fraction
import numpy as np
import matplotlib.pyplot as plt

plt.style.use('dark_background')
plt.rcParams.update({
    'figure.facecolor': '#111111',
    'axes.facecolor': '#111111',
    'axes.edgecolor': '#444444',
    'axes.labelcolor': '#cccccc',
    'xtick.color': '#888888',
    'ytick.color': '#888888',
    'grid.color': '#333333',
    'text.color': '#cccccc',
    'figure.figsize': (10, 2.5),
})
What is a Tone?
At its most basic, a tone is any periodic vibration repeating at a regular rate — a waveform cycling at some frequency. We measure frequency in Hertz (Hz), which simply means “cycles per second.” A tone vibrating at 440 Hz completes 440 cycles every second — this is the standard tuning reference, the concert A above middle C.
The higher the frequency, the higher we perceive the pitch. The lower the frequency, the lower the pitch.
t = np.linspace(0, 1, 1000)
freq = 4

fig, axes = plt.subplots(1, 2, figsize=(10, 2.5))

axes[0].plot(t[:250], np.sin(2 * np.pi * freq * t[:250]), color='#64a0ff', linewidth=1.8)
axes[0].set_title('One cycle', fontsize=10)
axes[0].set_xlabel('Time')
axes[0].set_yticks([])

axes[1].plot(t, np.sin(2 * np.pi * freq * t), color='#64a0ff', linewidth=1.8)
axes[1].set_title(f'Repeating at {freq} Hz', fontsize=10)
axes[1].set_xlabel('Time')
axes[1].set_yticks([])

plt.tight_layout()
plt.show()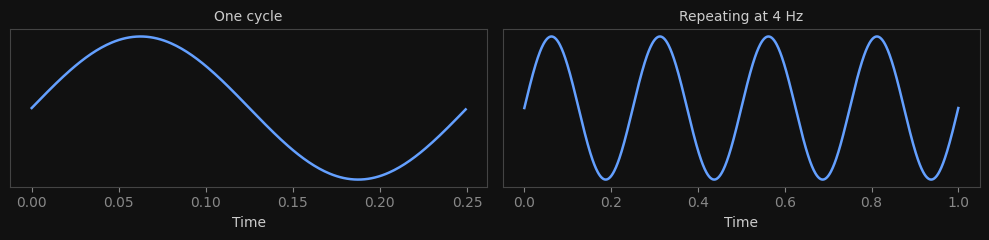
Ratios as Intervals
Musical intervals arise from ratios between frequencies. If we take a frequency and multiply it by a ratio, we get a new frequency — and the relationship between those two frequencies is what we hear as an interval.
| Ratio | Interval | Example (from 440 Hz) |
|---|---|---|
| 2/1 | Octave | 880 Hz |
| 3/2 | Perfect fifth | 660 Hz |
| 4/3 | Perfect fourth | ~587 Hz |
| 5/4 | Major third | 550 Hz |
| 6/5 | Minor third | 528 Hz |
| 5/3 | Major sixth | ~733 Hz |
These ratios are simple — their numerators and denominators are small integers. Simple ratios tend to produce intervals that sound consonant (stable, blending). More complex ratios produce intervals that sound more dissonant (tense, active).
An interval is a ratio, and combining intervals means multiplying ratios. A perfect fifth (3/2) followed by a major third (5/4) gives us 3/2 × 5/4 = 15/8 — a major seventh.
Let’s see (and hear) what some of these look like when superimposed:
t = np.linspace(0, 1, 2000)
base = 3

intervals = [
    ('3/2 — Perfect fifth', Fraction(3, 2)),
    ('5/4 — Major third', Fraction(5, 4)),
    ('2/1 — Octave', Fraction(2, 1)),
]

fig, axes = plt.subplots(1, len(intervals), figsize=(12, 2.5))

for ax, (label, ratio) in zip(axes, intervals):
    f1, f2 = base, float(base * ratio)
    ax.plot(t, np.sin(2 * np.pi * f1 * t), color='#64a0ff', linewidth=1.2, alpha=0.8, label=f'{base} Hz')
    ax.plot(t, np.sin(2 * np.pi * f2 * t), color='#ff6464', linewidth=1.2, alpha=0.8, label=f'{f2:.1f} Hz')
    ax.set_title(label, fontsize=9)
    ax.set_yticks([])
    ax.set_xticks([])
    ax.legend(fontsize=7, loc='upper right')

plt.tight_layout()
plt.show()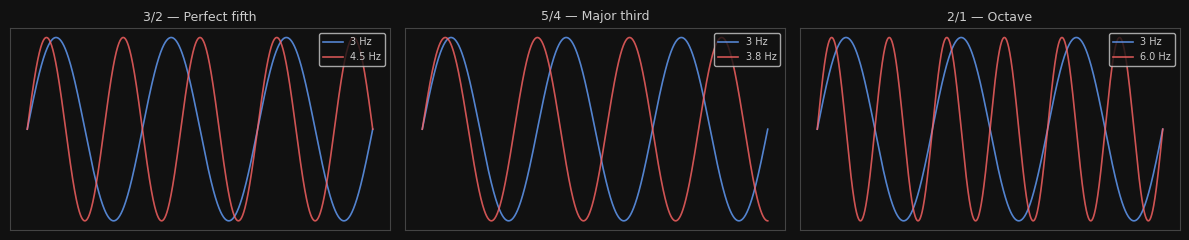
Octave Equivalence
One ratio holds a special place: 2/1, the octave. Multiplying any frequency by 2 produces a pitch that sounds like the “same note” but higher. Dividing by 2 gives the same note but lower.
Why? Look at what happens when we superimpose a frequency with its octave — the higher wave completes exactly 2 cycles for every 1 cycle of the lower wave. They align perfectly at every period boundary. This clean alignment is why octaves sound so similar that we perceive them as “the same note.”
t = np.linspace(0, 2, 3000)
base = 2

fig, ax = plt.subplots(figsize=(10, 2.5))
for octave, alpha in [(1, 1.0), (2, 0.7), (4, 0.5), (8, 0.35)]:
    f = base * octave
    color = '#64a0ff' if octave == 1 else '#ff6464'
    ax.plot(t, np.sin(2 * np.pi * f * t), color=color, linewidth=1.3, alpha=alpha, label=f'{f} Hz (×{octave})')

ax.set_title('A tone and its octaves — all perceived as the "same note"', fontsize=10)
ax.set_yticks([])
ax.set_xticks([])
ax.legend(fontsize=8, loc='upper right')
plt.tight_layout()
plt.show()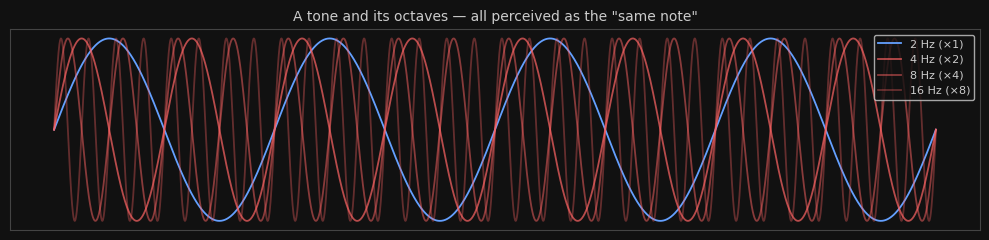
This property — that frequencies related by powers of 2 are perceived as equivalent — is called octave equivalence. It’s one of the few near-universals in music across world cultures: 440 Hz, 880 Hz, 220 Hz, and 1760 Hz are all perceived as “A.”
Mathematically, this means we can always multiply or divide a ratio by powers of 2 (2/1, 4/1, 1/2, 1/4, ...) and arrive at an “equivalent” pitch. This will become important when we start working with lattices and harmonic spaces.
A brief aside: the term equave generalizes this concept beyond octaves — where some interval other than 2/1 serves as the equivalence boundary. We won’t dwell on this now, but it’s worth knowing the term exists. Most of what follows will assume octave equivalence (2/1).
Tones as frequencies, intervals as ratios, octaves as powers of 2 — these are the building blocks. In the next notebooks, we’ll see how these relationships can be organized spatially in tone lattices.